

Updates to Microbiome Analysis in ERGO
/Data mining and visualization just got easier in ERGO’s newest microbiome analysis update.
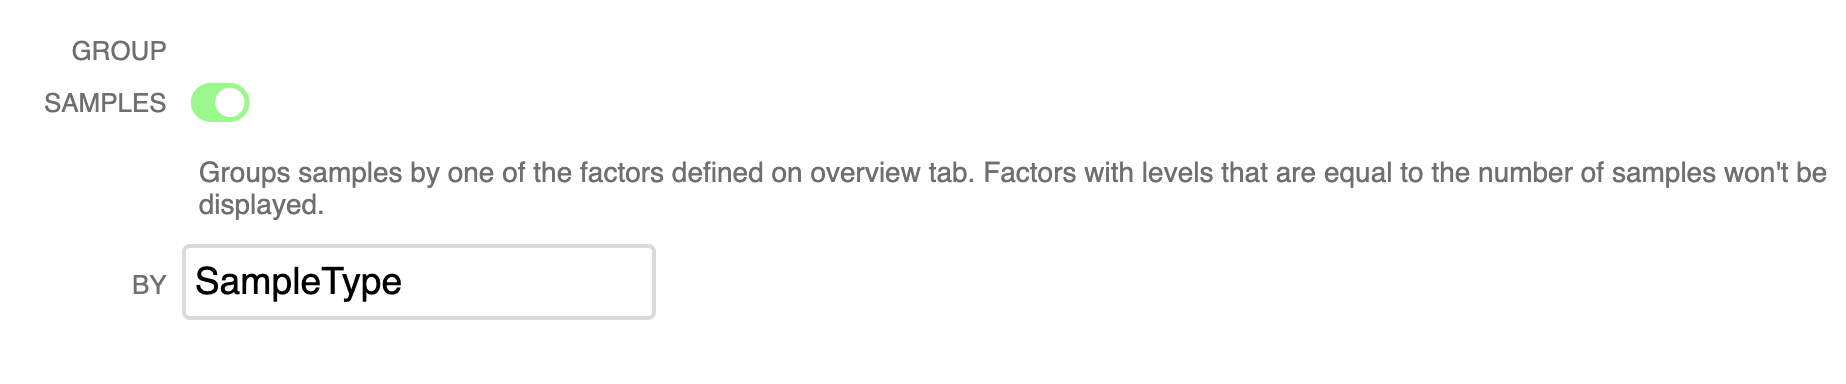
▸ Group Samples by Factors
Easily group samples by factors (that you can create or import from the ‘Overview’ tab). Click the toggle and select the factor to group by.
Using this feature you can easily see that for example, Corynebacterium are associated with human skin samples in these data.
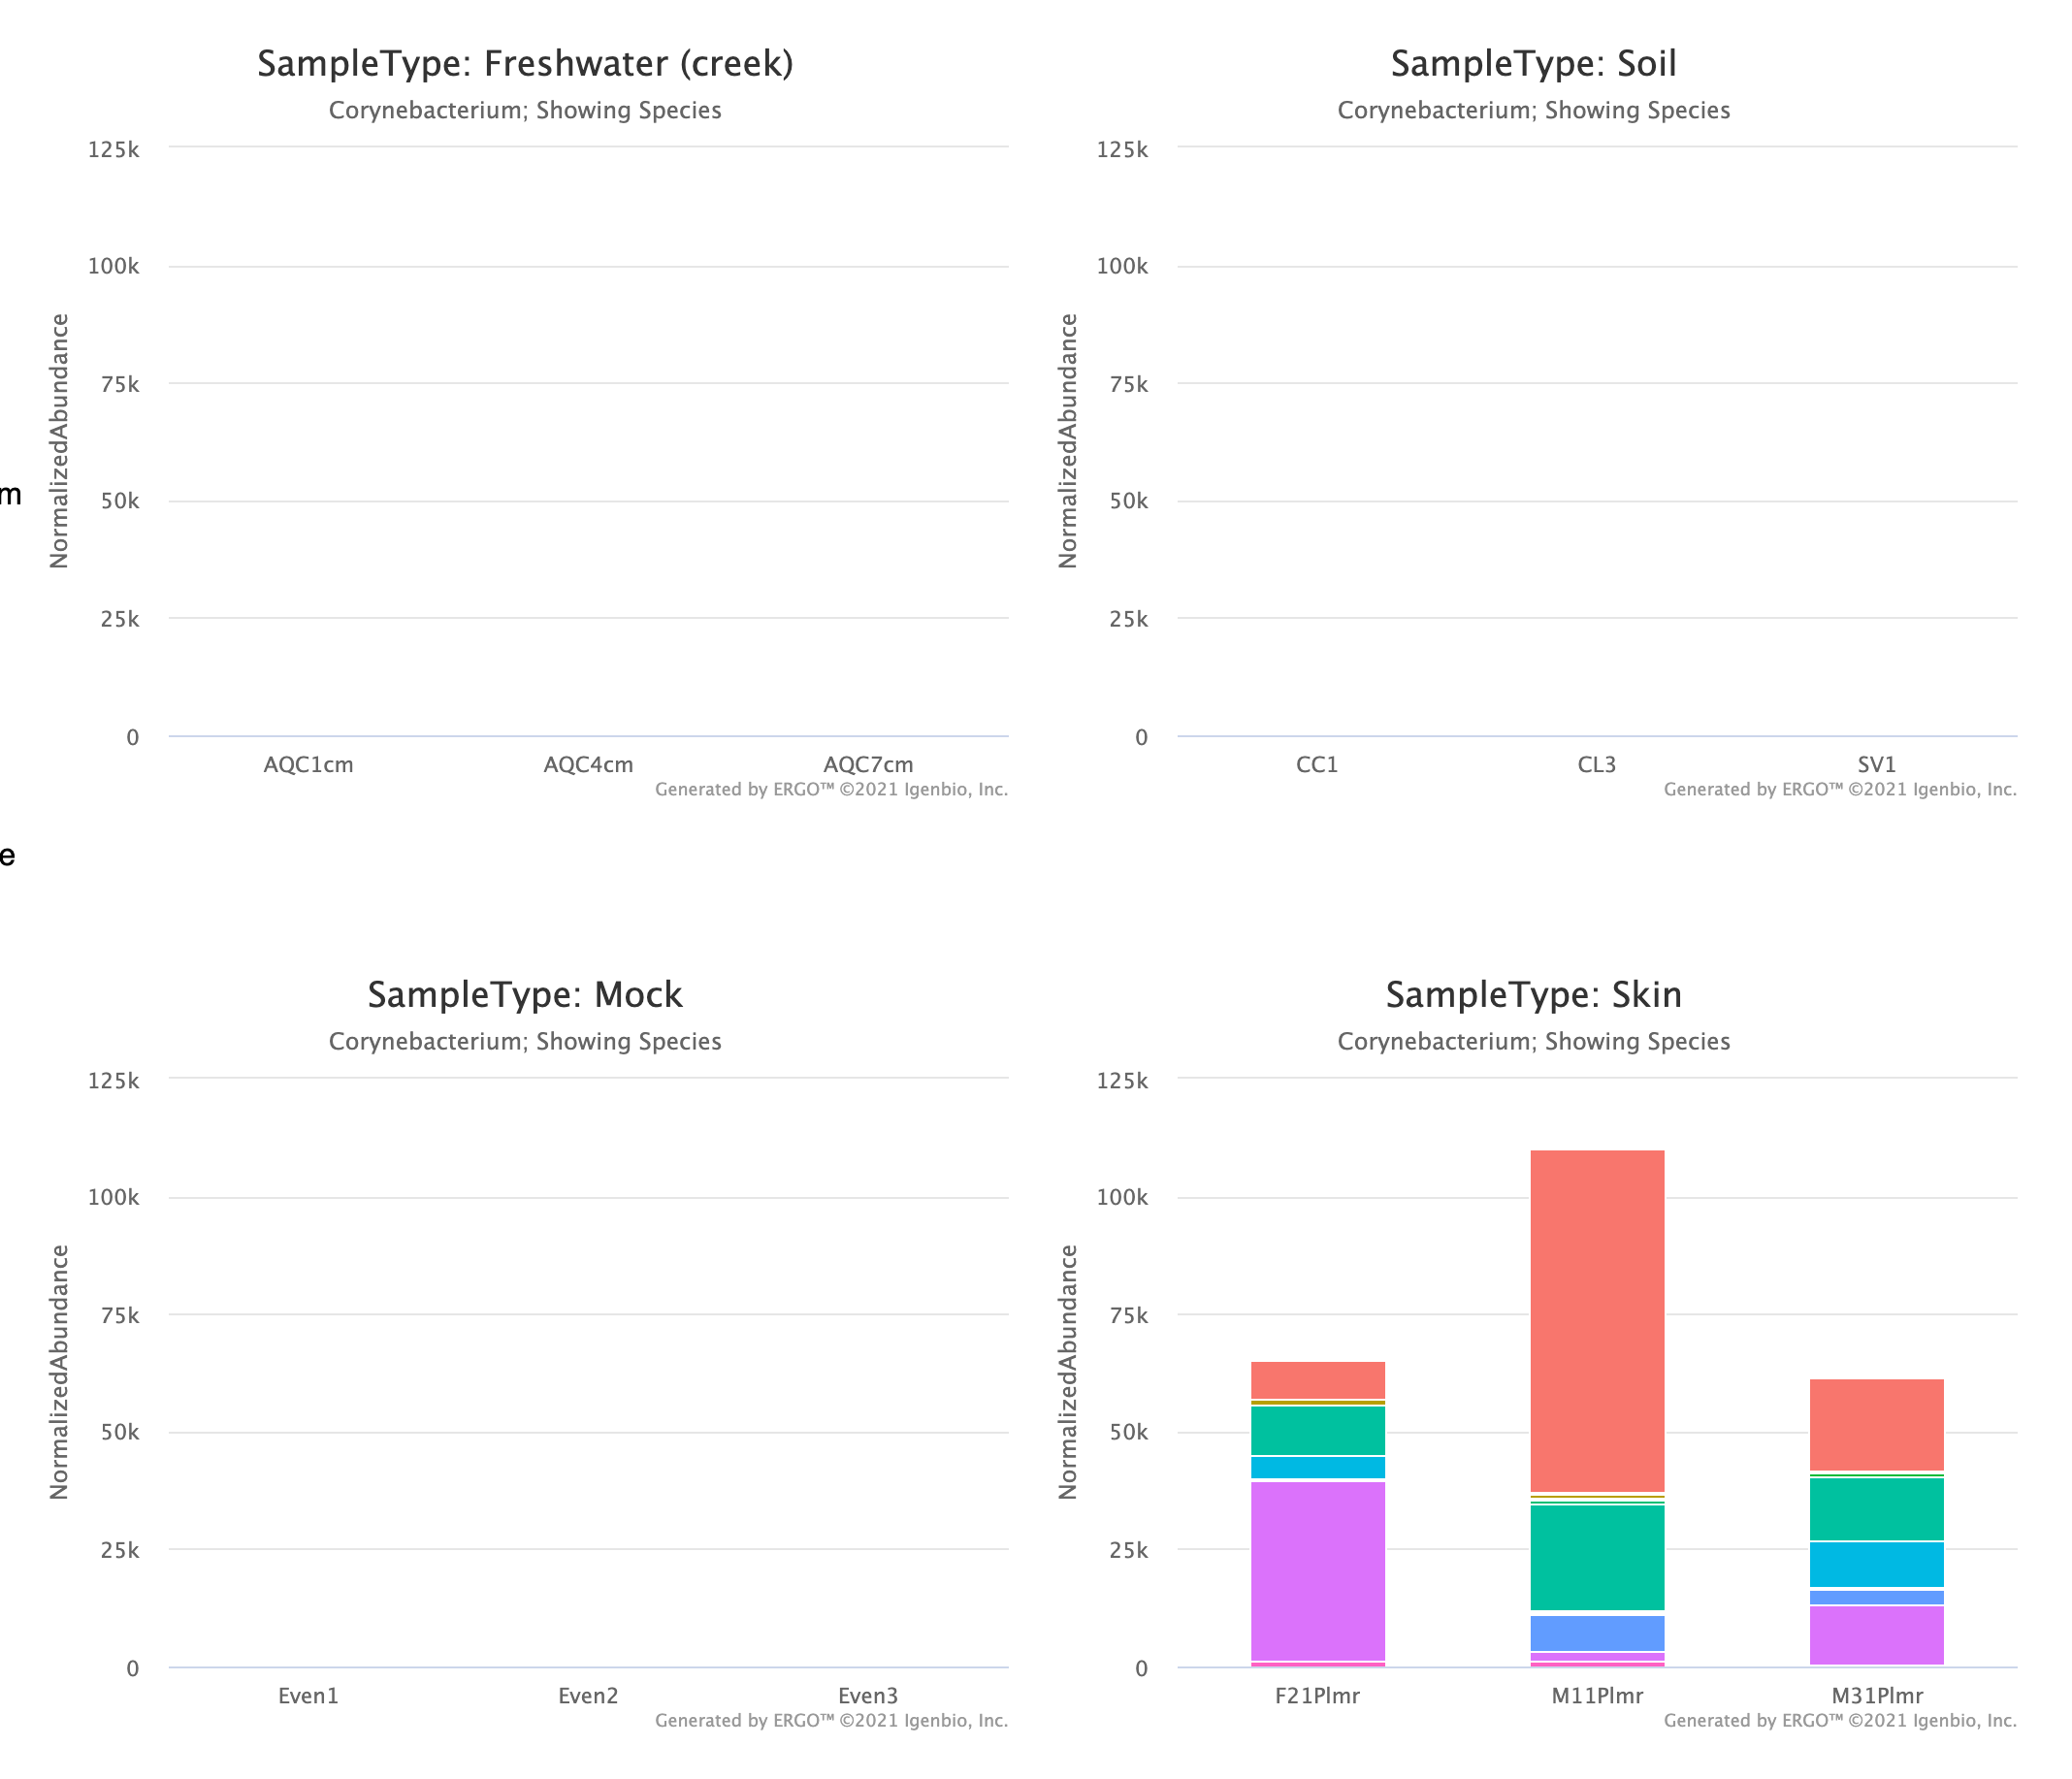
▸ Clicking on columns/bars in the plot “drills down” to the next level of Taxonomy and applies a filter for that level.
For example clicking on a column labeled Bacteria would filter all taxa by Bacteria and descend one level to “Phylum”.
▸ Search
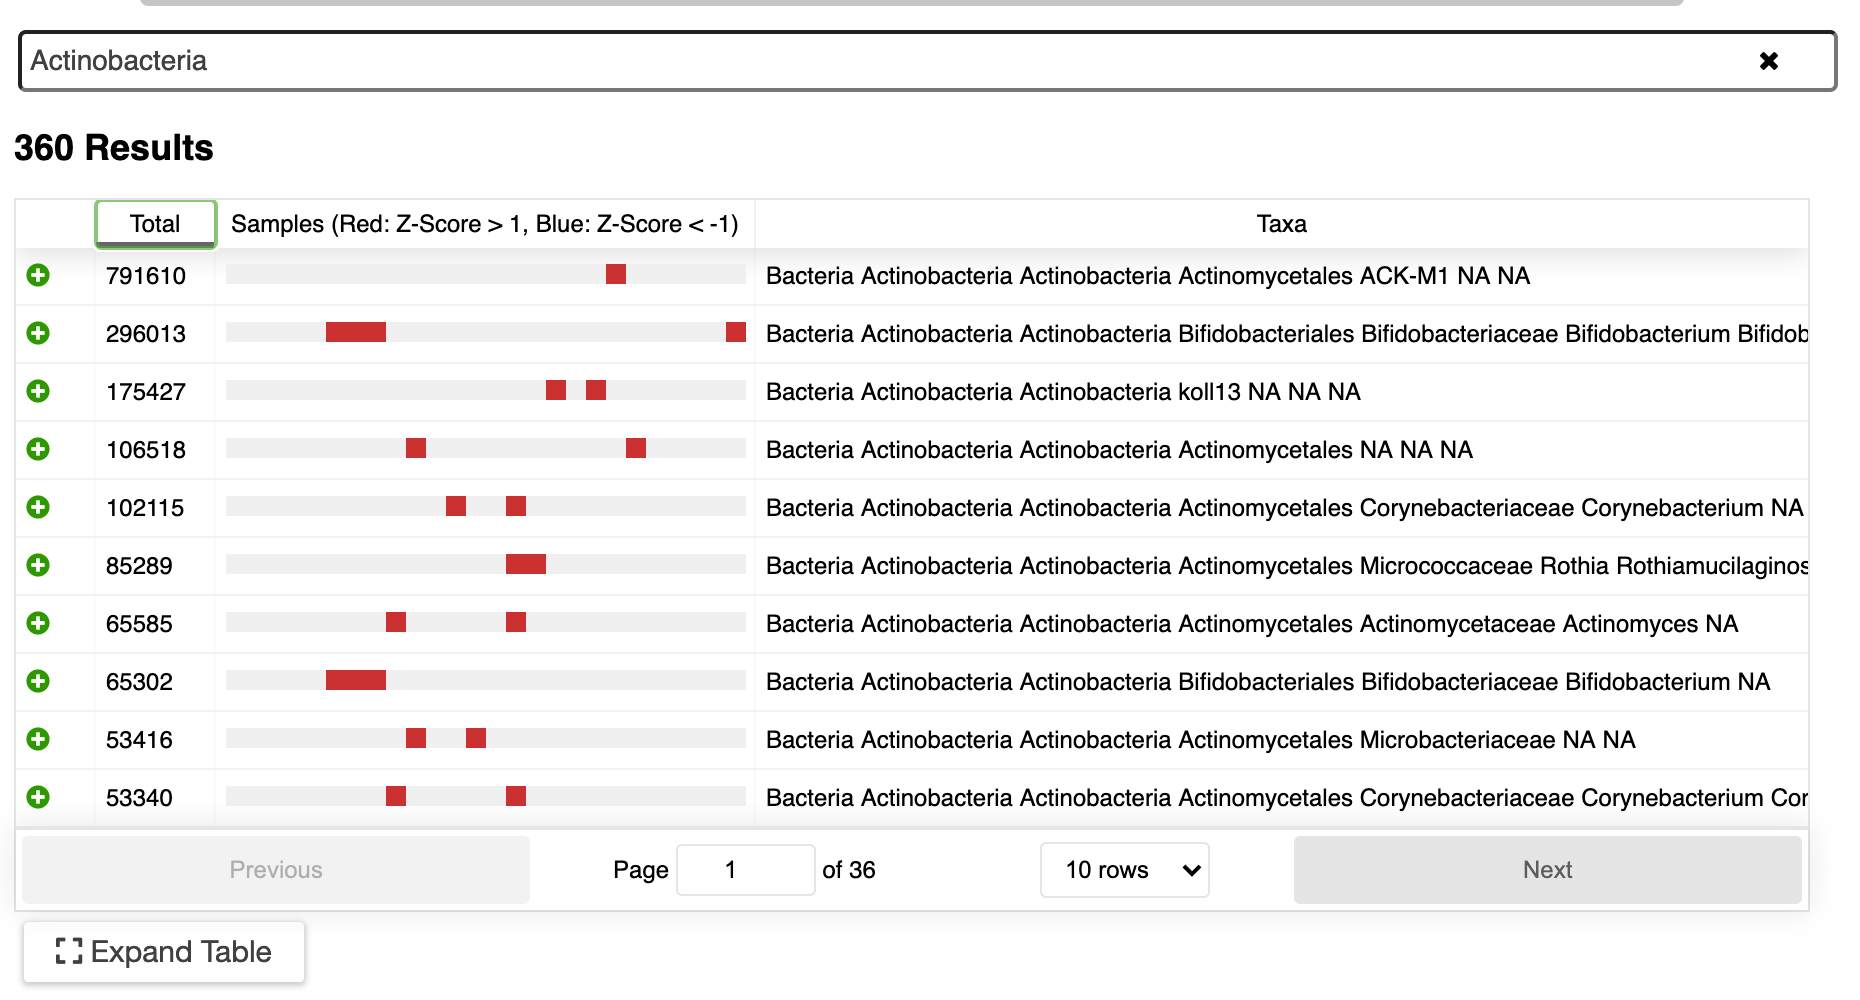
Interested in what Actinobacteria are present in your data? Just type “actinobacteria” in the search box. A list of all available Actinobacteria will be shown (see below). The boxes indicate samples with the taxa that have potentially interesting z-scores (number of standard deviations from the mean): red boxes represent scores greater than 1, blue boxes represent scores less than -1. This is a quick way to identify which taxa may be differentially abundant in the data.
▸ Normalization
ERGO by default now normalizes by the median sequencing depth ( S/T * M; where A= abundance, T=Total for that sample, M=Median sequencing depth) so that abundances are comparable between samples. This gives a general picture. Check for statistically significant differences with ERGO’s Linear Discriminate Analysis using LEfSe.
▸ Other Improvements
Including:
Settings for granular low abundance taxa filtering to increase chart performance and reduce noisy plots
More color schemes
Improved chart legend
