
New ERGO Feature: Metabolomics Data Integration
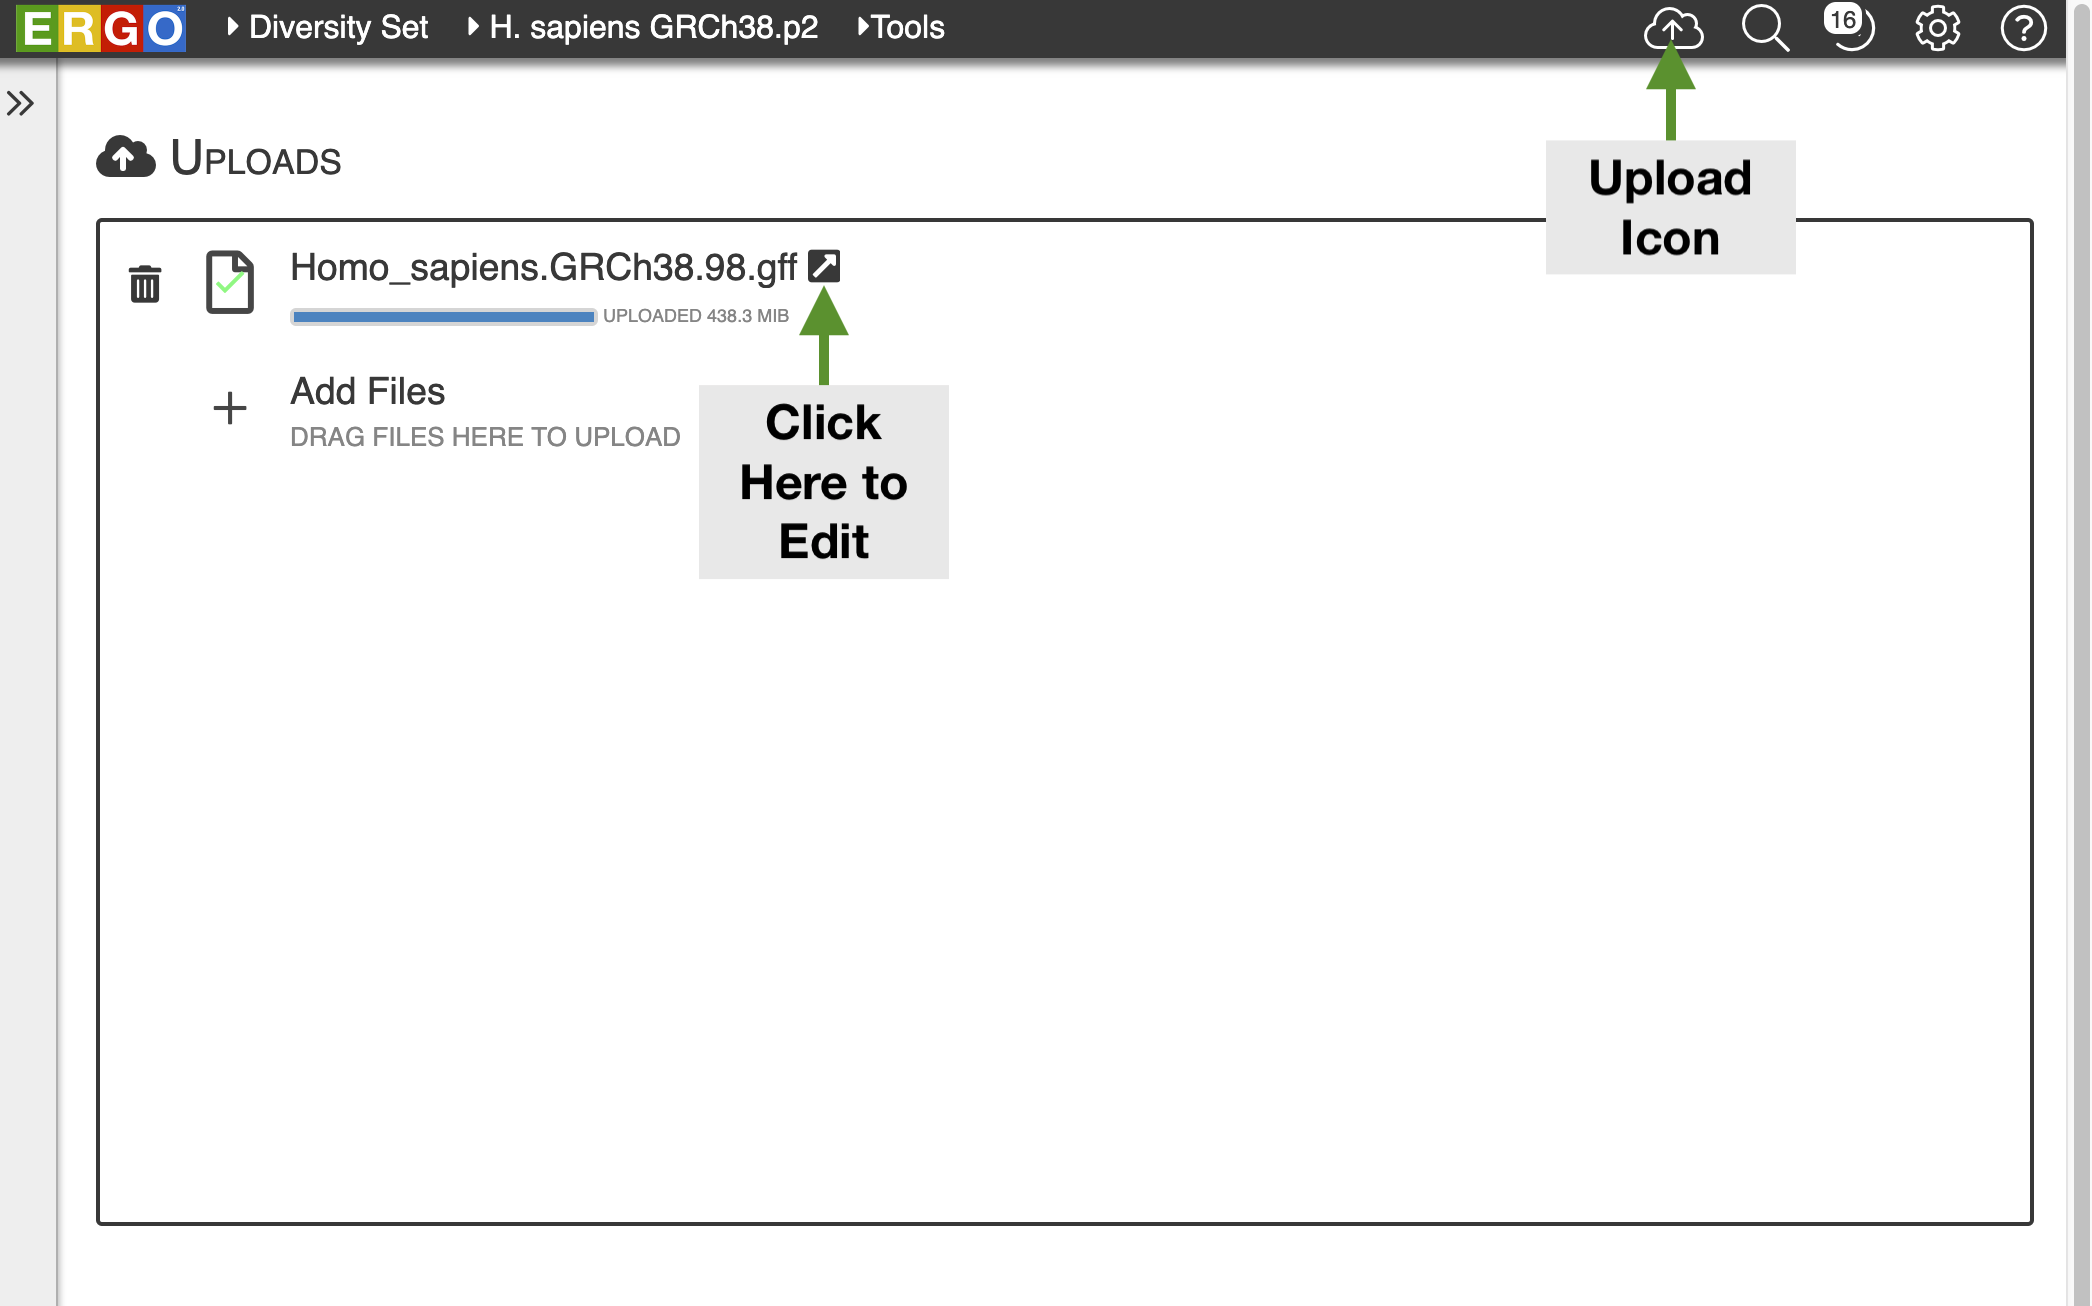
/ERGO now supports the integration of data from your metabolomics experiments. ERGO identifies the top most interesting pathways (KEGG and BioCyc) for your set of metabolites, taking into account selected genome context. Getting started is as easy as importing a table.

Metabolomics concentrations are displayed on pathways and can be integrated with gene expression data for additional insight.