

ERGO Updates
/Igenbio’s developers have spent this summer creating many ‘quality of life’ improvements to ERGO’s user interfaces. Today I’ll highlight a few changes:
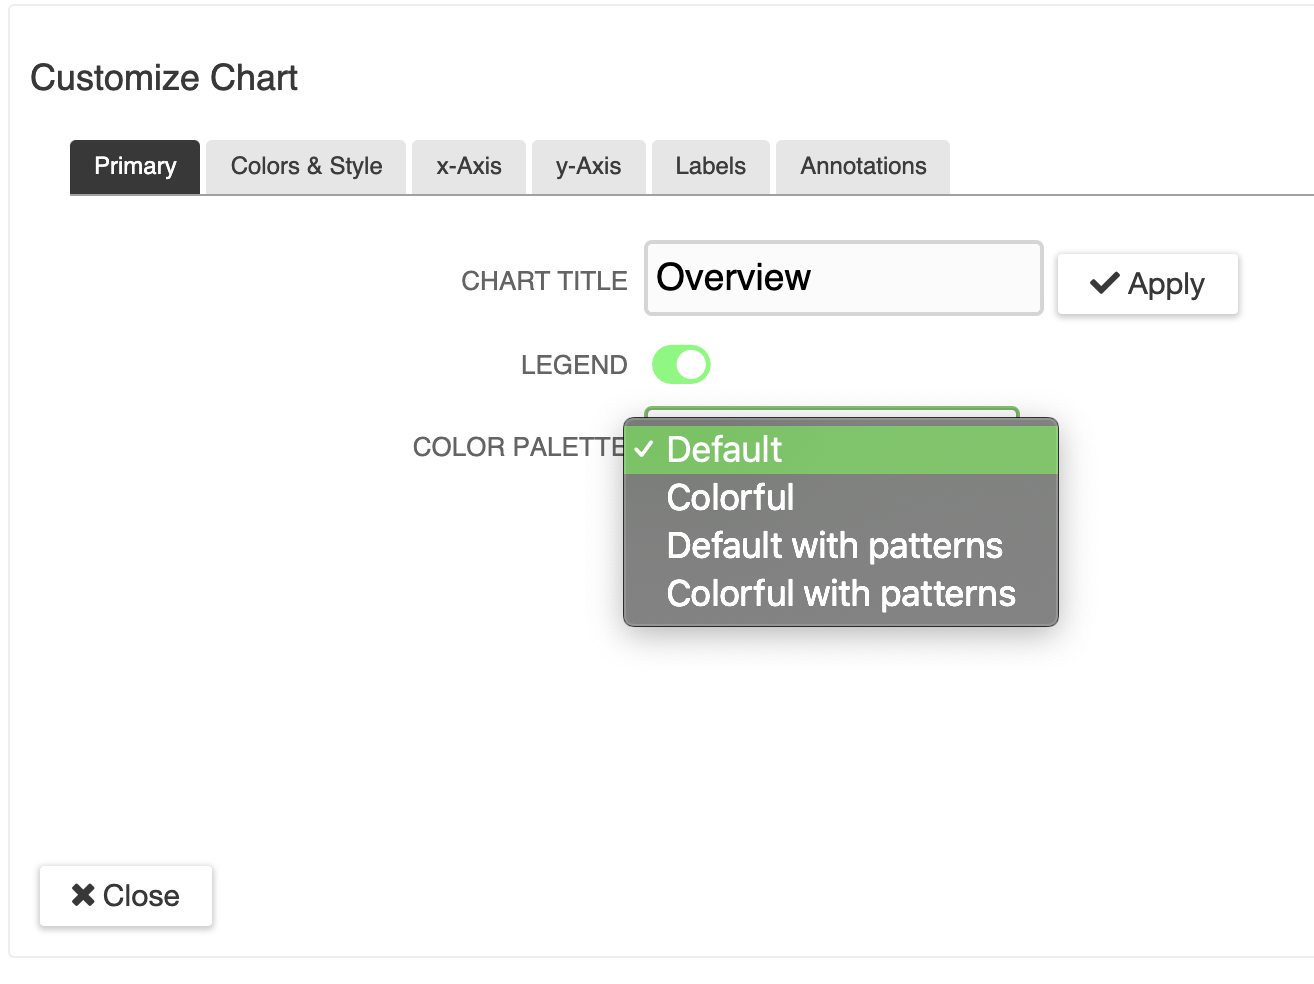
New color palette options available under chart customizations
General Changes
Most charts now support four new color modes, including two that are colorblind friendly palettes, such as the default color scheme.
Color palettes can be selected from the “Customize” menu below the chart.
In Expression Analysis:
More detail in error dialogs. For example, when you are running a DESeq2 analysis, if there is a problem (not enough replicates) you’ll get a more detailed message that could aid you in correcting the issue.
Changed the truncation of long titles. Now the analysis tab will auto expand to display the entire title. This will make it easier to differentiate between open analysises.
When creating new analysis, there is now an option to add/remove samples or conditions. This will allow you to quickly create customized analysis.

Easily remove conditions and samples to create the custom analysis that you want
Differential Analysis
New Column: ‘Category’. This contains all of the categories at the current ontological level that this feature belongs to.
Hovering over a row in the DEG table highlights the categories (or feature in Volcano plot) in the chart that the feature belongs to.
New table options to set the precision and number display preferences for fold change, p-value, q-value, and others.
More meta feature data is now indexed when searching the table, including KEGG, COG, Pfam, and pathways.
New option to sort the plot by value (smallest to largest)
New plot options, such as Min Fold Change, Max Fold Change, Median Fold Change, Count (of genes), Mean -log10 p-value, Mean -log10 q-value. This will enable you to quickly identify which category has the most significance.
New option option to plot two different series - on for all changes that have positive fold change and another for those with negative fold change. This will make it more obvious of the apparent direction of the category as a whole as averaging the fold change had the effect of making the category look as though at no change at all.
New filter option for filtering by absolute value of fold change. This way you can filter the table (and subsequent plots) by features with a fold change in either direction.
New “Bar” plot.
Gene Set Enrichment Analysis (GSEA)
Added condition toggle for heatmaps. Under “More Chart Options” there is an option to quickly toggle on/off a condition to be displayed on the heatmap.
KEGG Analysis results can now be projected onto KEGG Pathways.

Demonstration of new plot option to have two separate series - one representing the mean fold change of all positive fold changes and another representing the mean of all negative fold changes.
In Read QC Analysis
Added details of over-represented sequences, which could be an indication of adapters or other sequences that need to be filtered
Some speed improvements